Dashboards
Data Visualization has not only been a part of my work, but a great way to organize my life and hobbies. Below are a couple of examples.
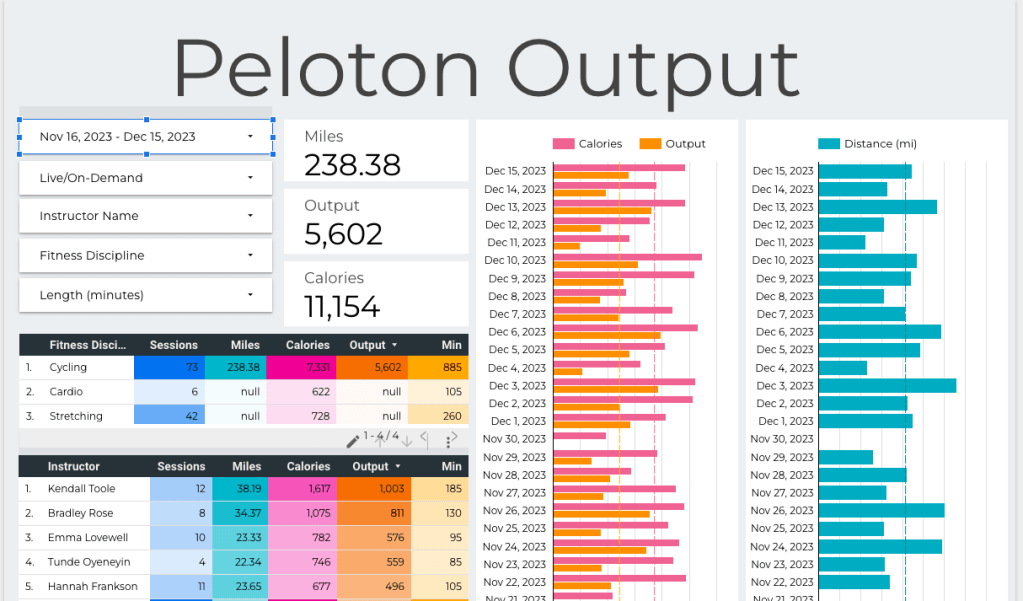
Project: Peloton Workouts
Background: I work out as often as I can and the data from each workout can be downloaded from their website, placed in google docs, and a dashboard can be setup using Looker (formerly Google Data Studio)
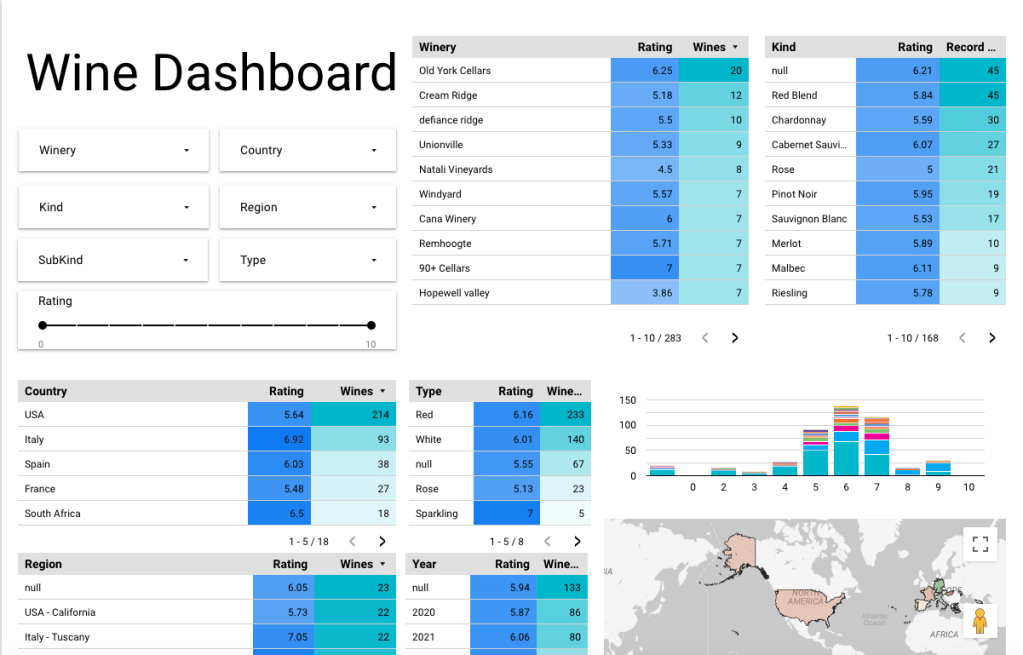
Project: Wine Dashboard
Background: It seems every part of the country has a local winery popping up. A while back, I started to keep track of the wines I had tried so I know what I like, from what country and region, and other information. Being fortunate enough to travel has also allowed me to broadened my palate.
The results visualize here allowed me to know more about what kind of wines I like and some of results have actually surprised me.